Executive Order Analysis
Interactive and static visualizations of semantic trends in U.S. executive orders.
Interactive Visualizations
Open Interactive Time-Series Plot
Year on x-axis with semantic components over time.
Open Timeline Animation
Animated year-by-year semantic evolution.
Static Visualizations
PCA by President
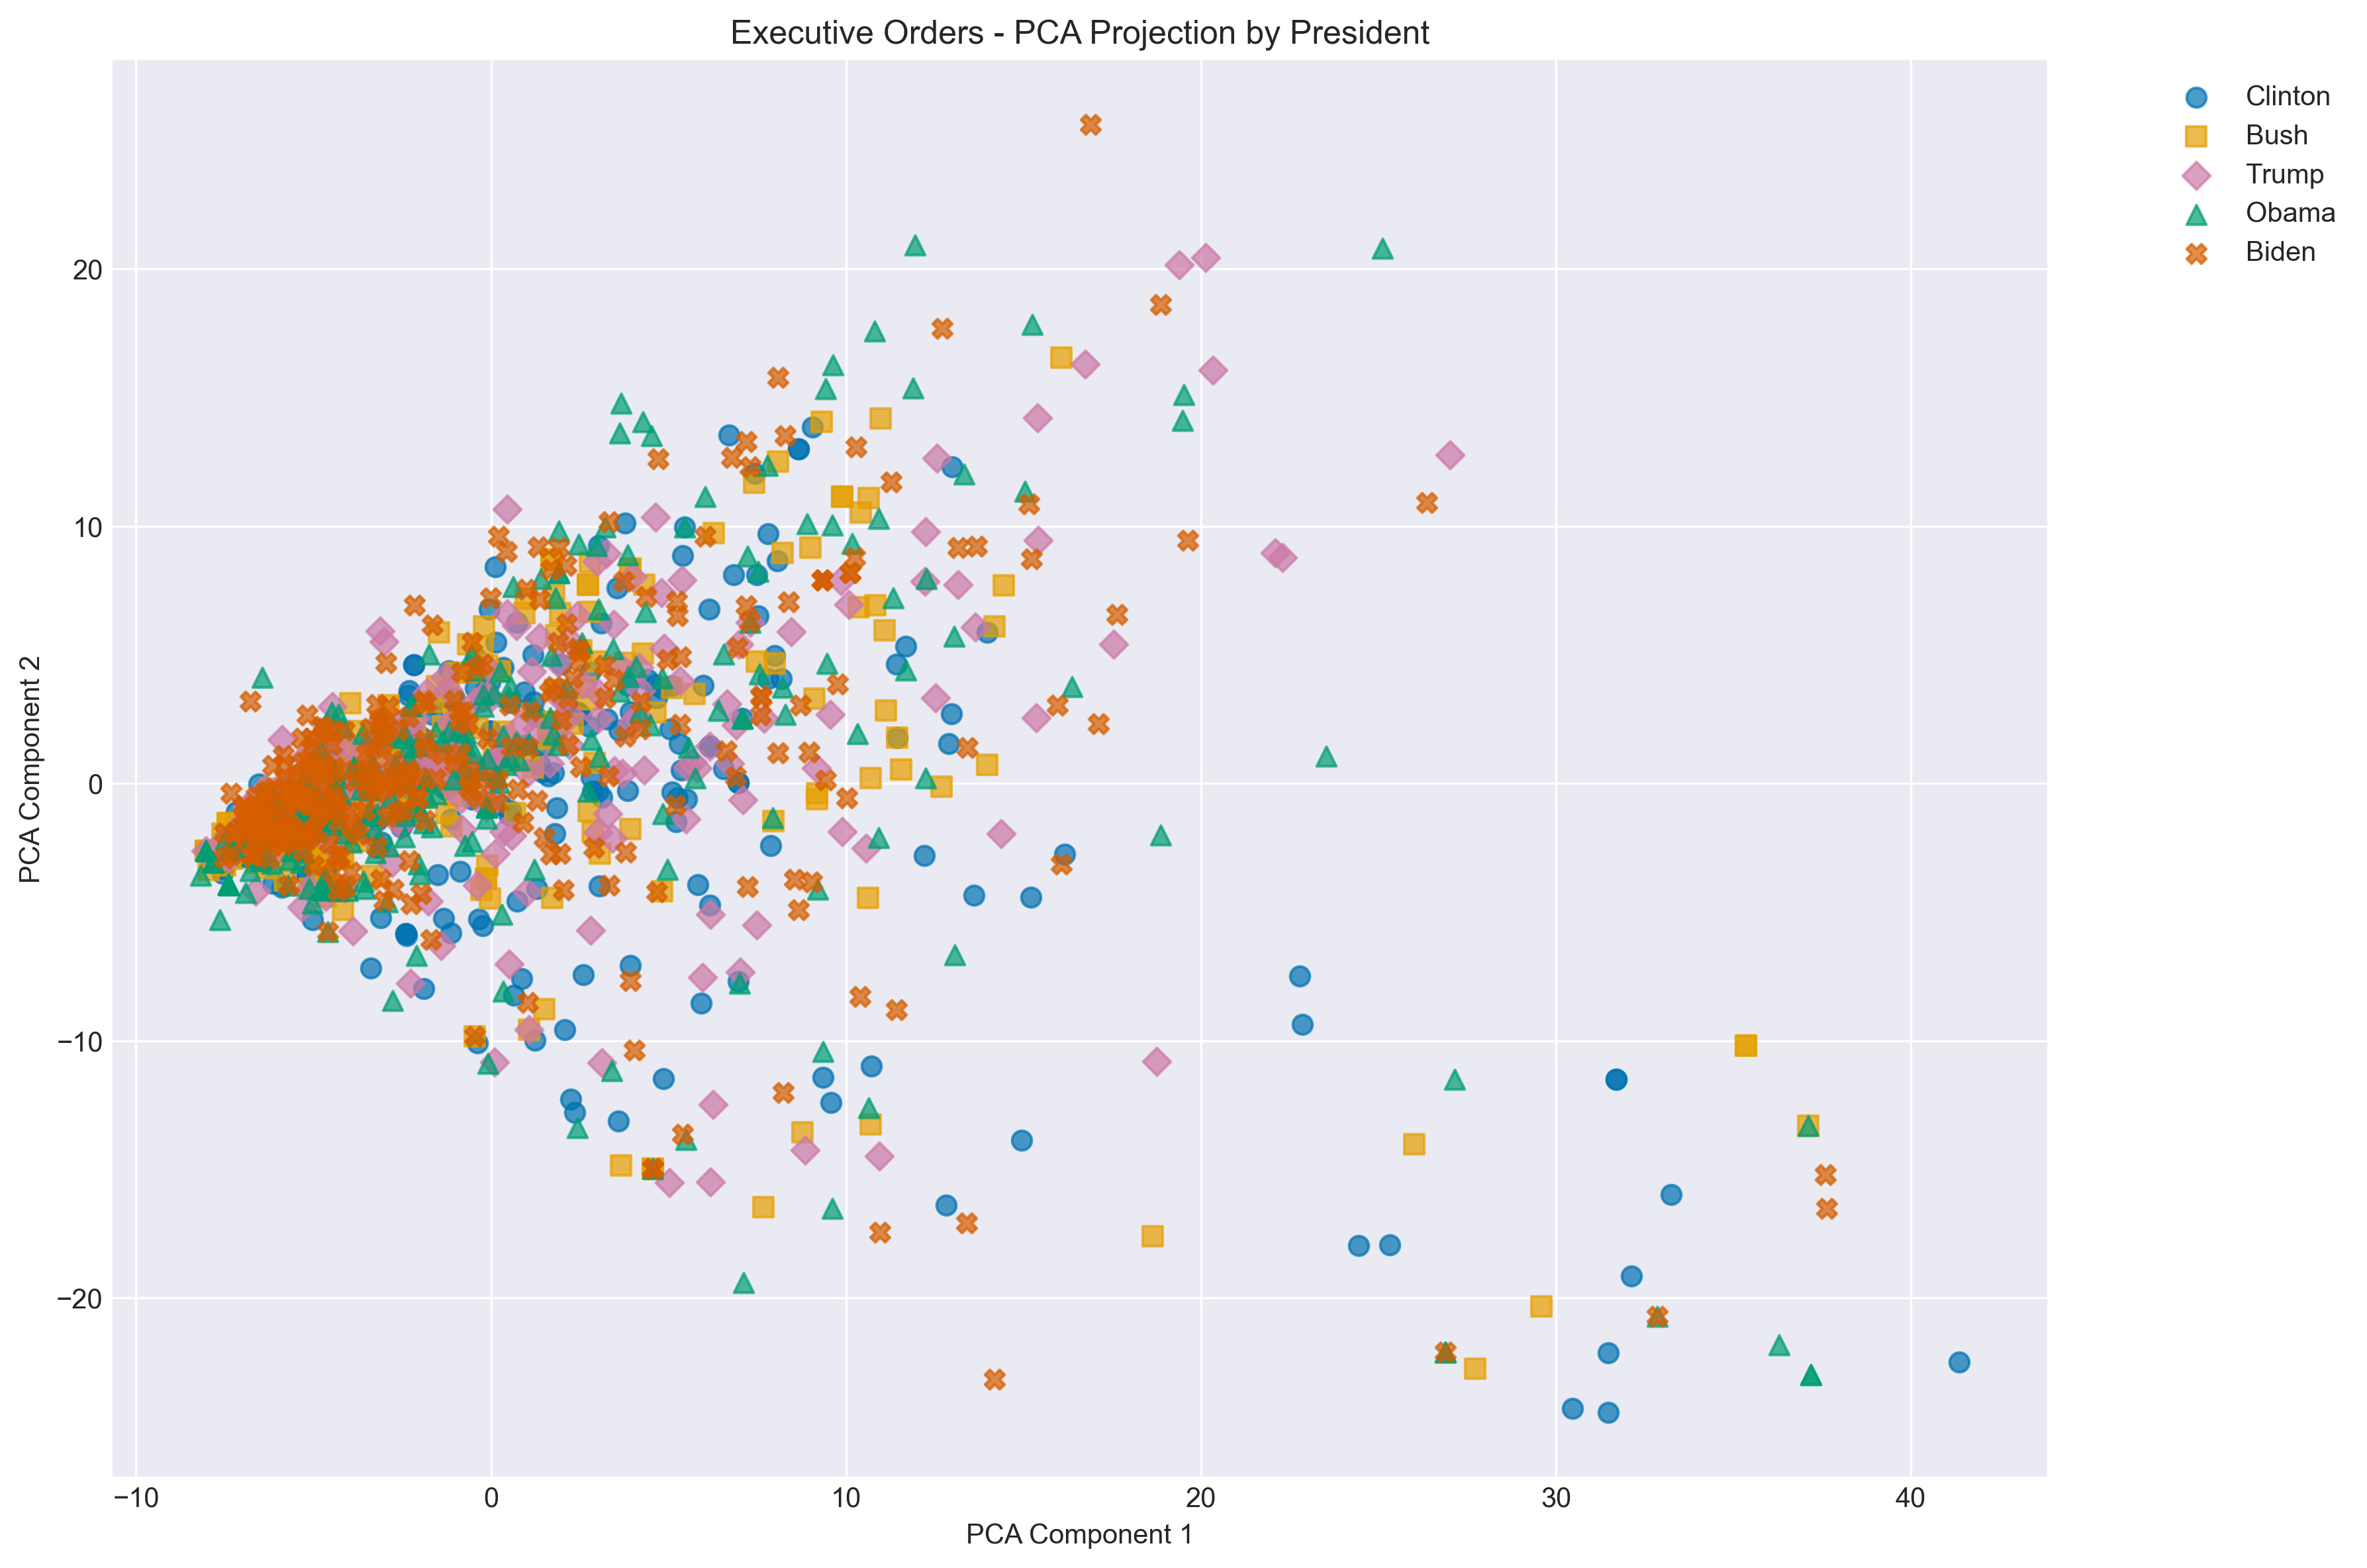
Click image to open full size.
t-SNE by President
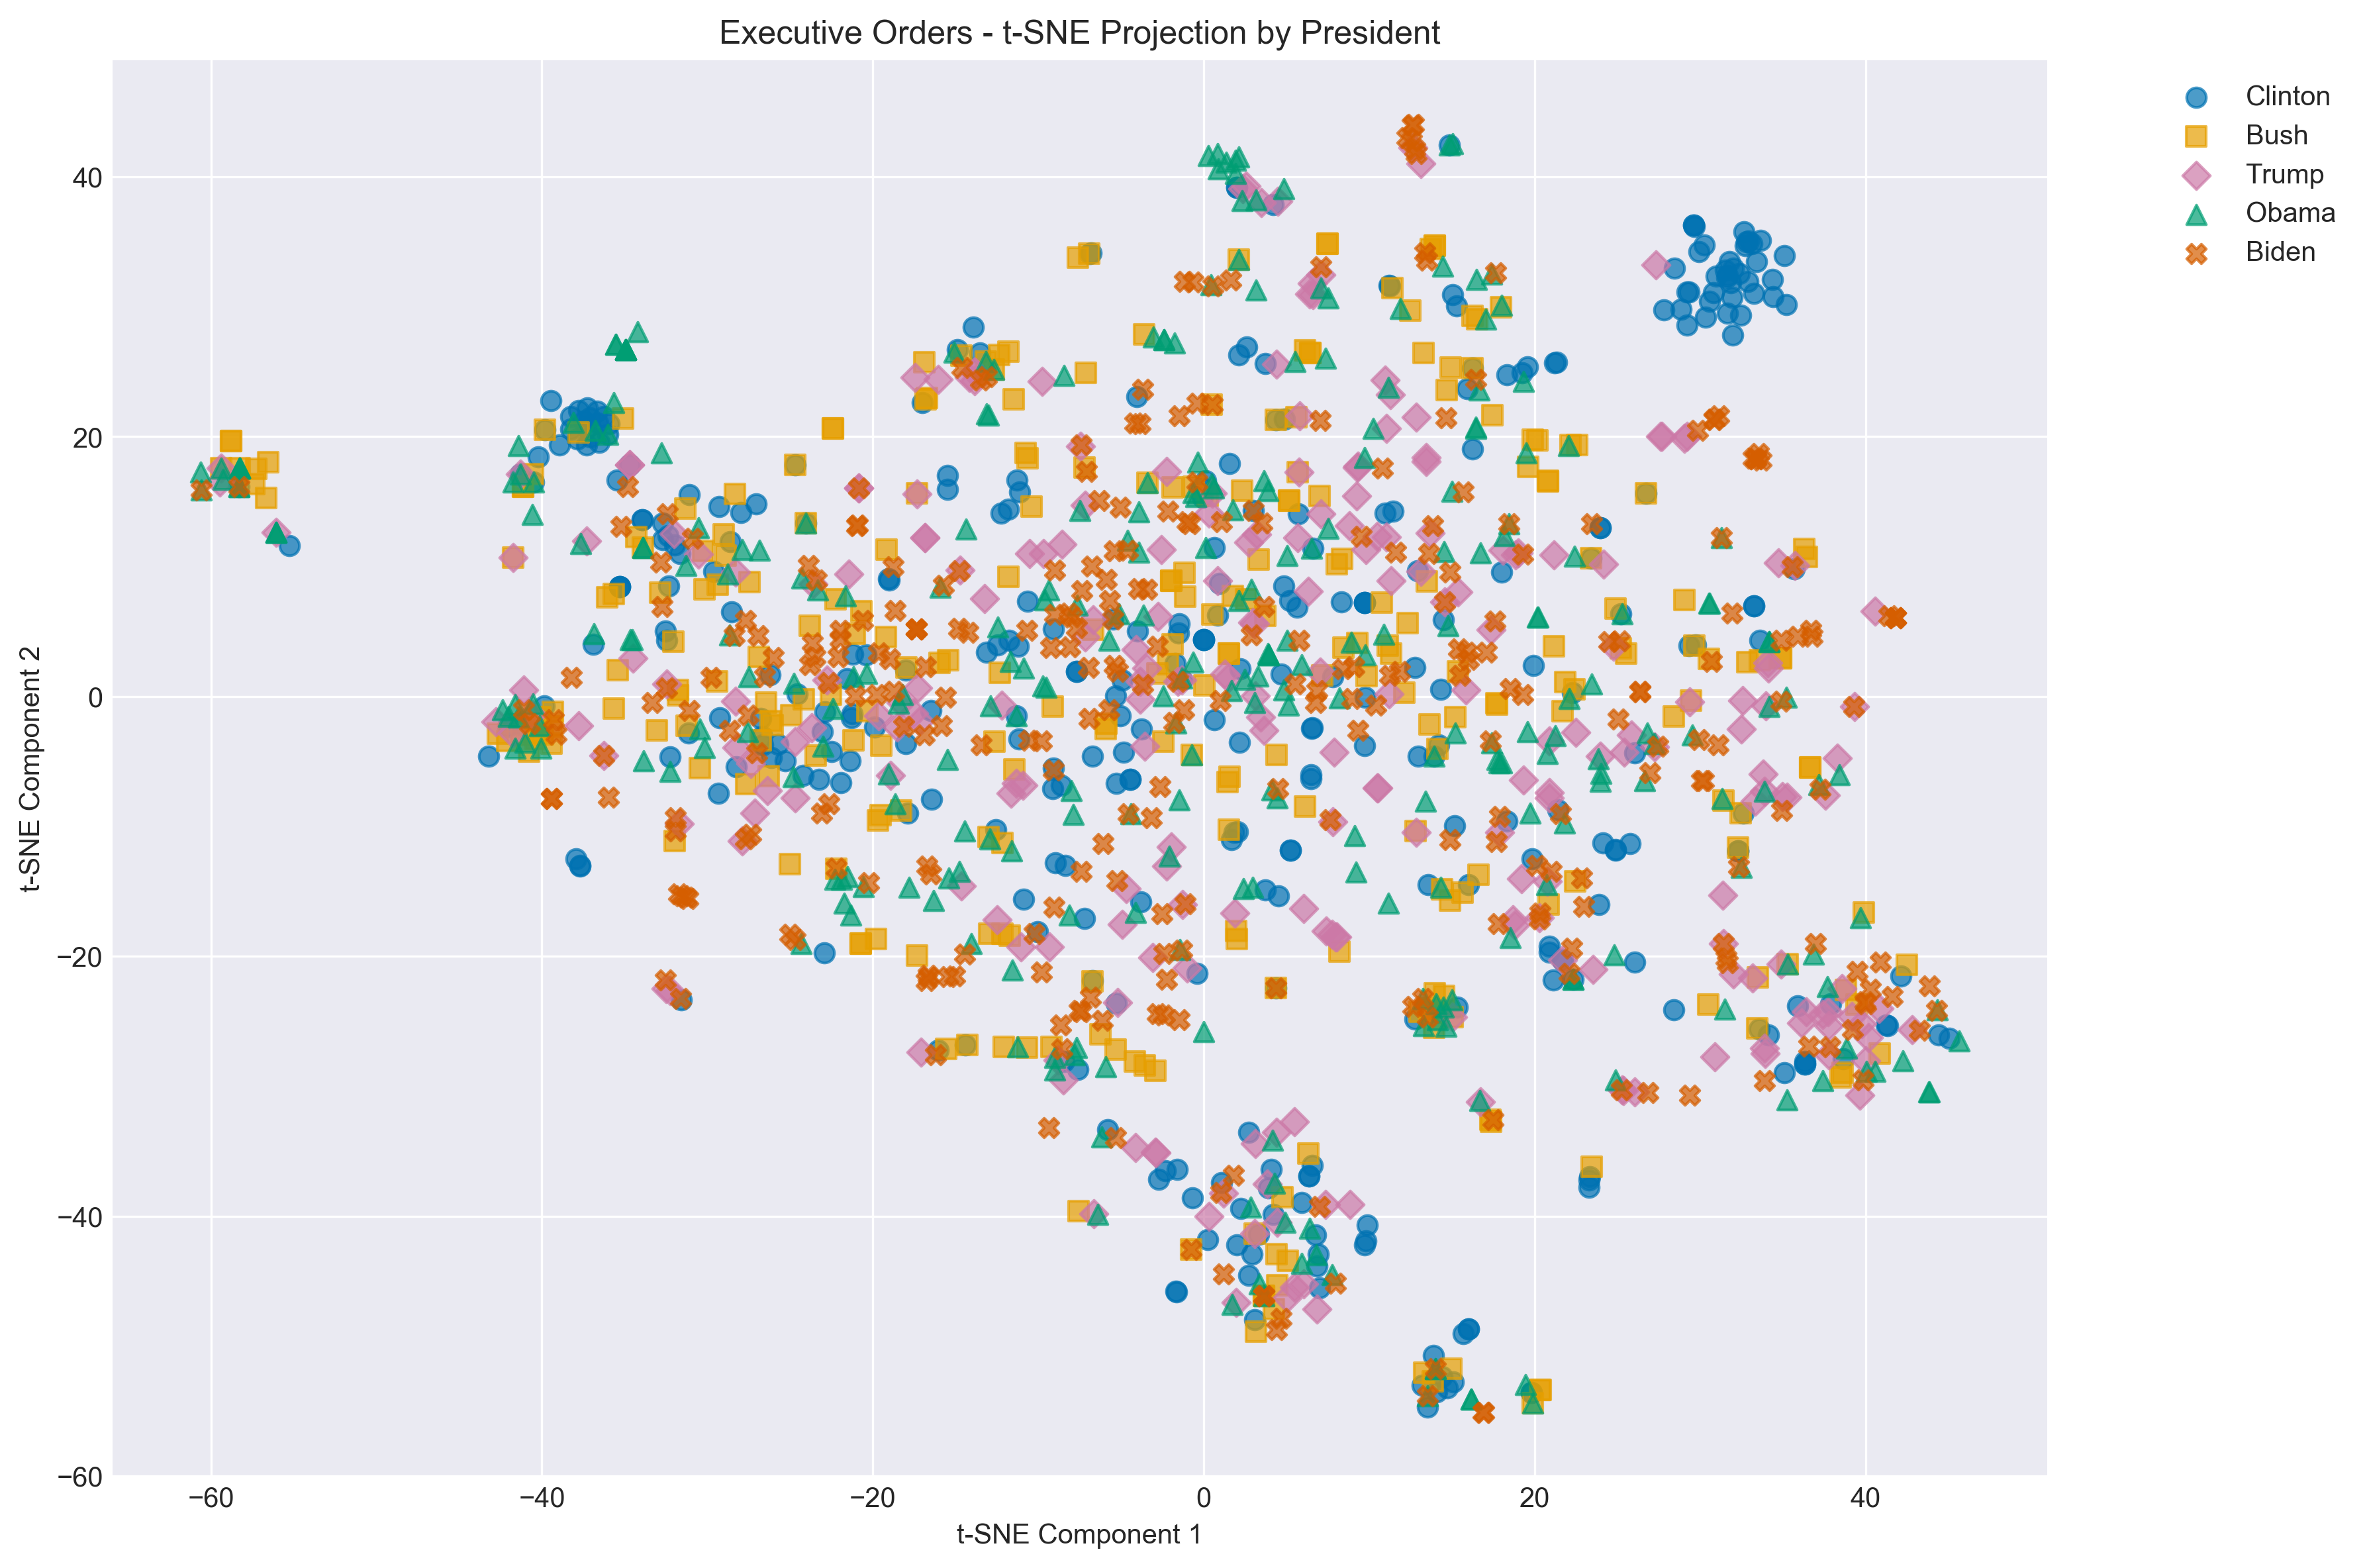
Click image to open full size.
UMAP by President
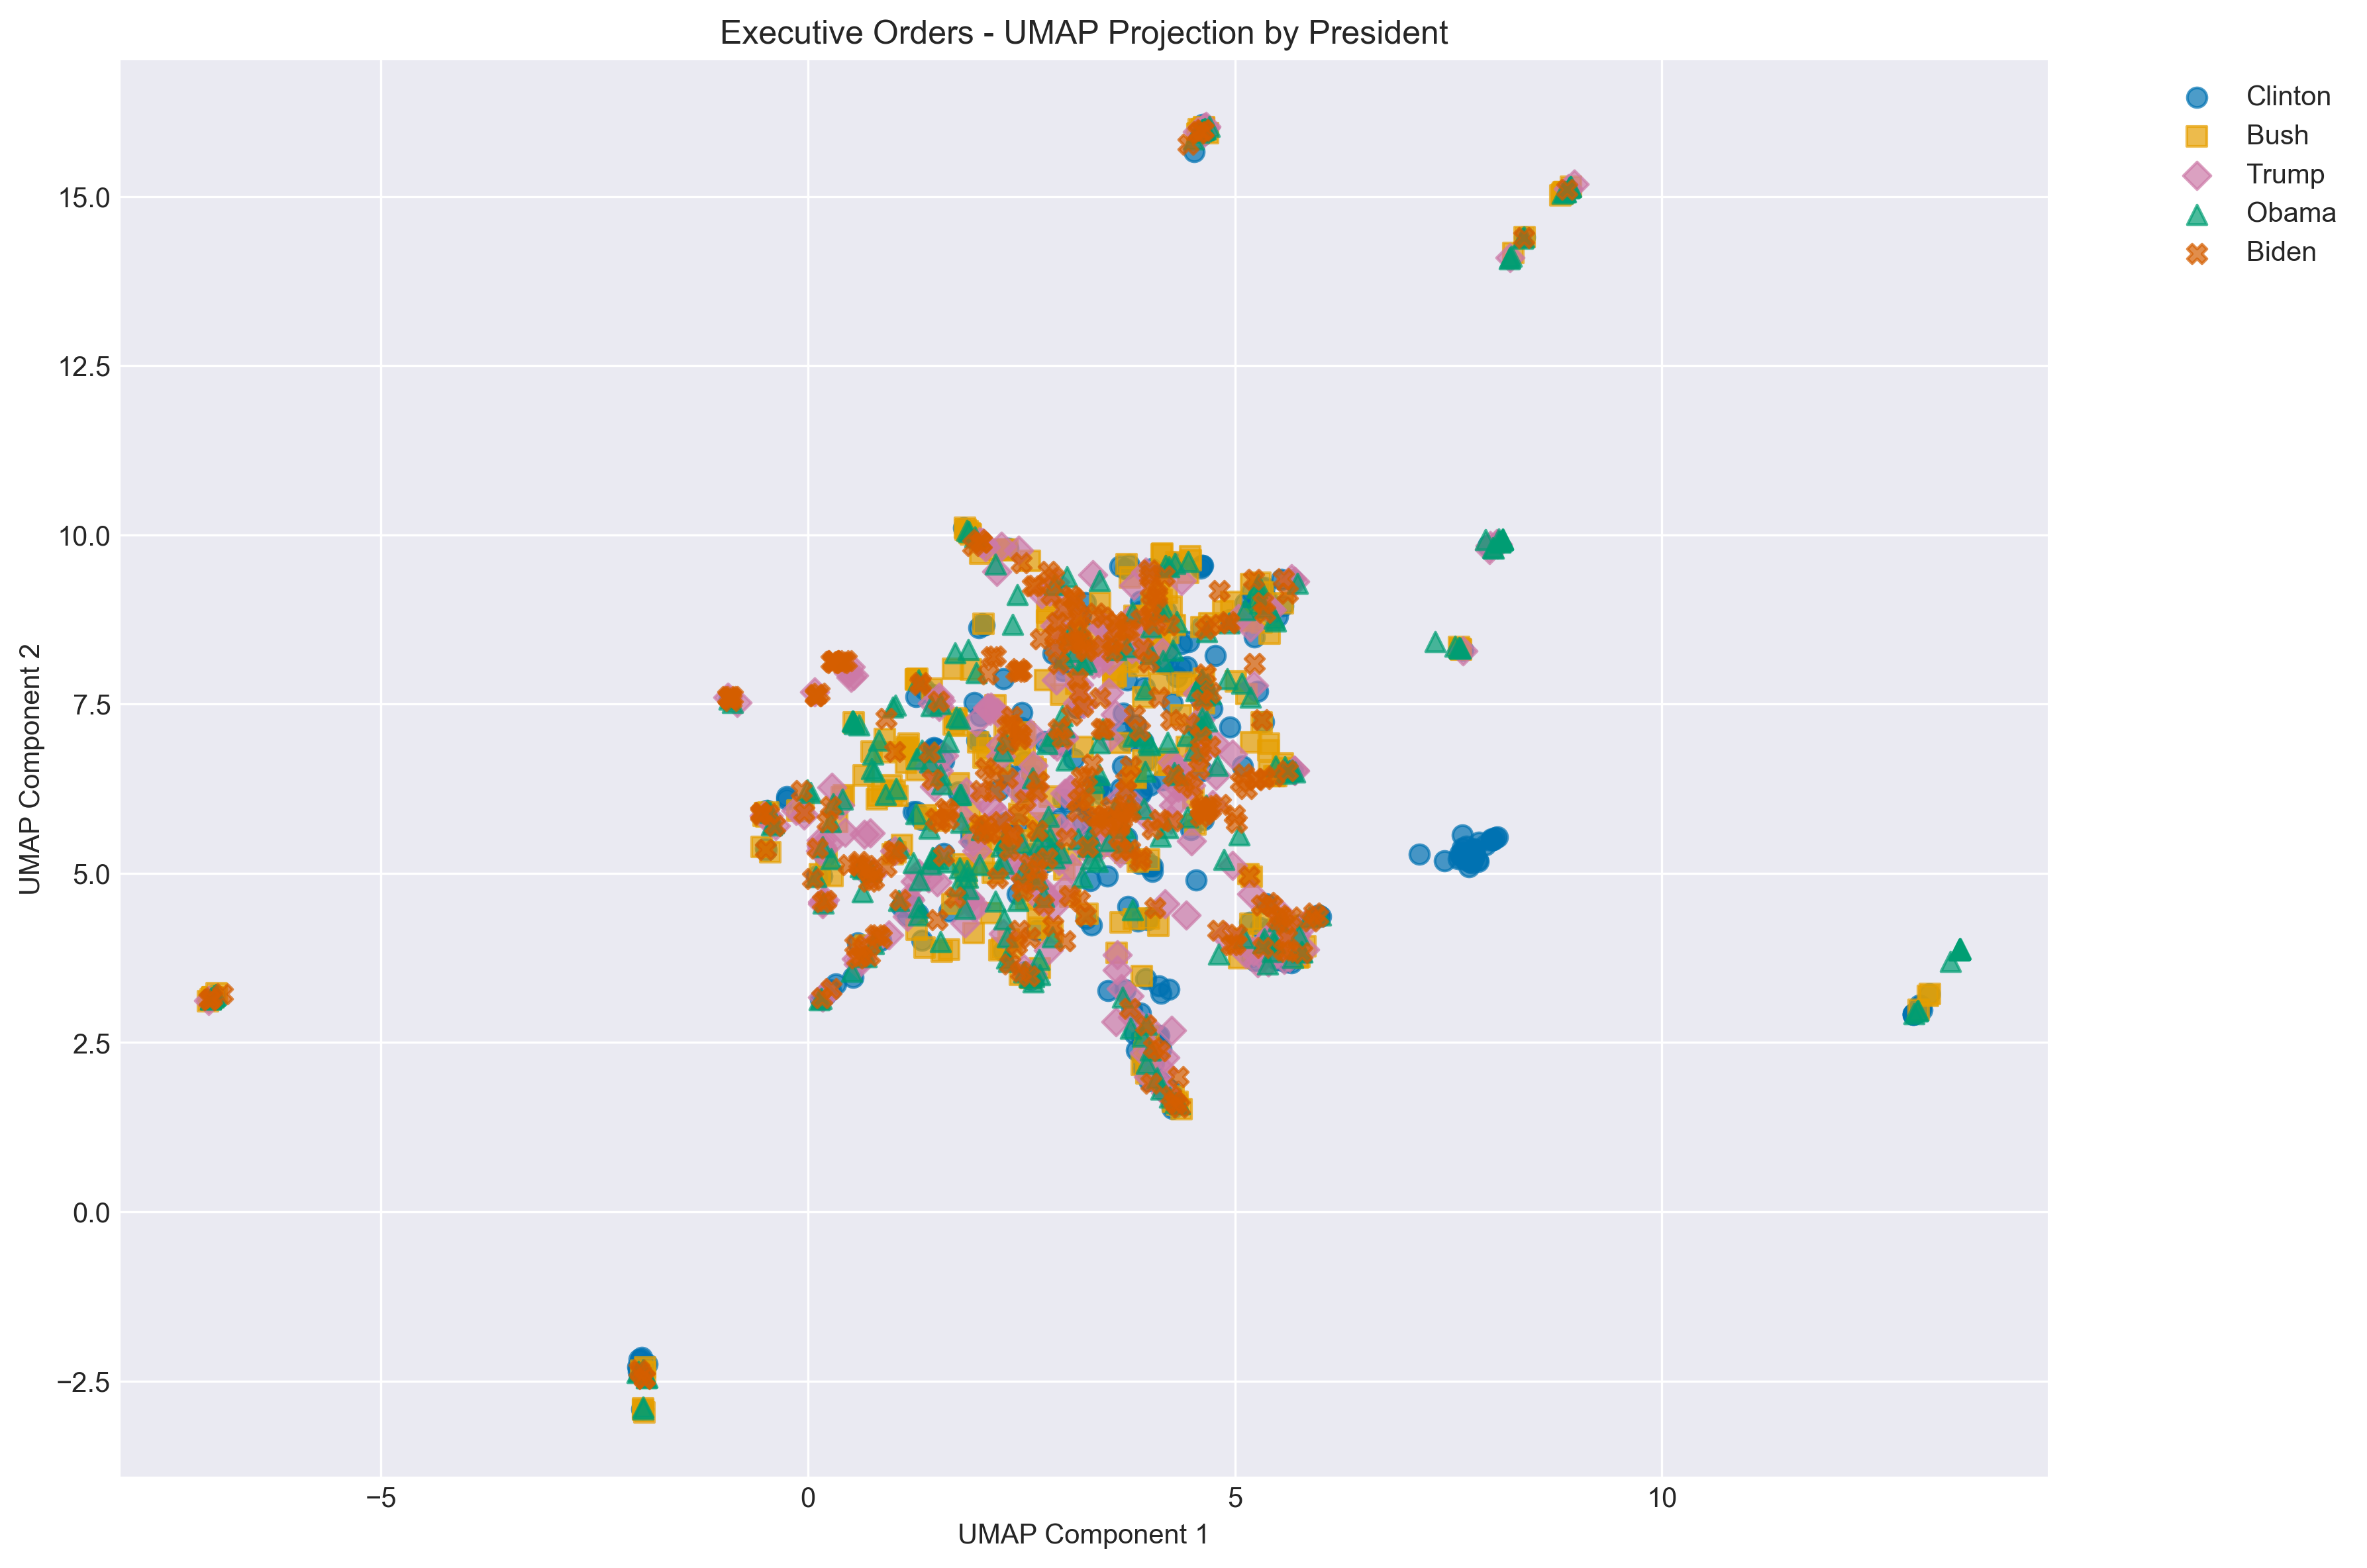
Click image to open full size.
PCA Clusters
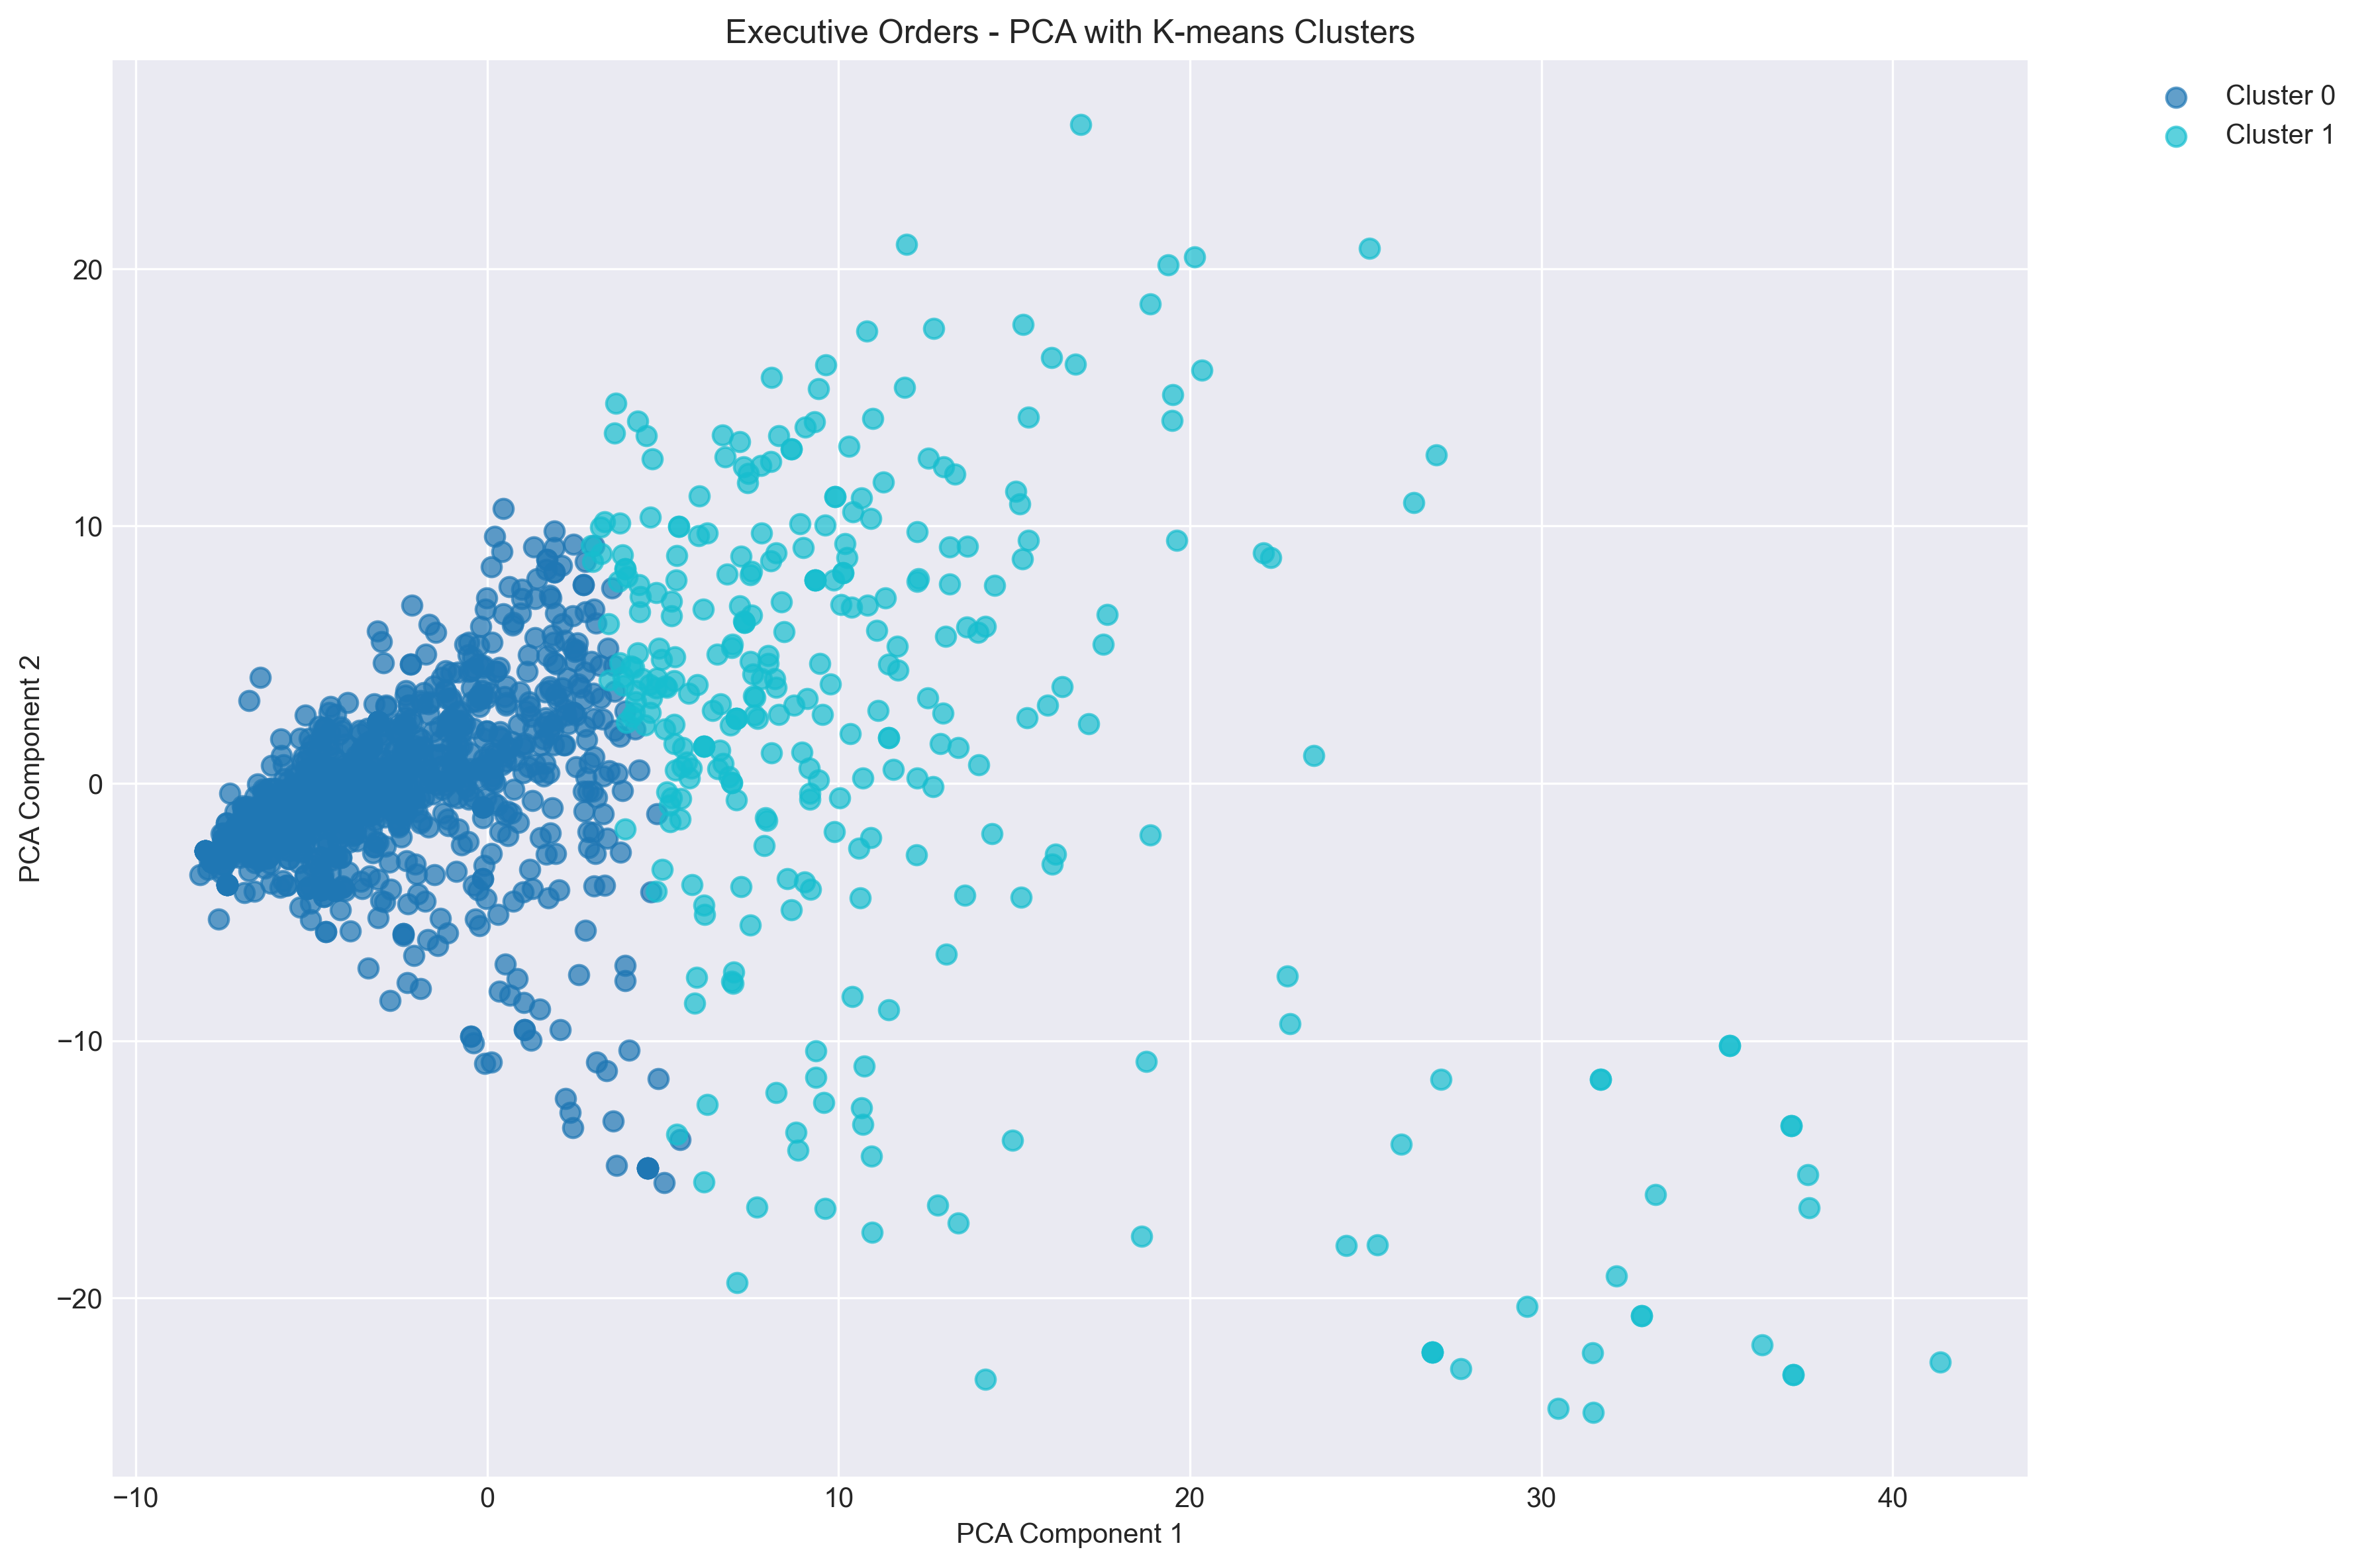
Click image to open full size.
Cluster Composition
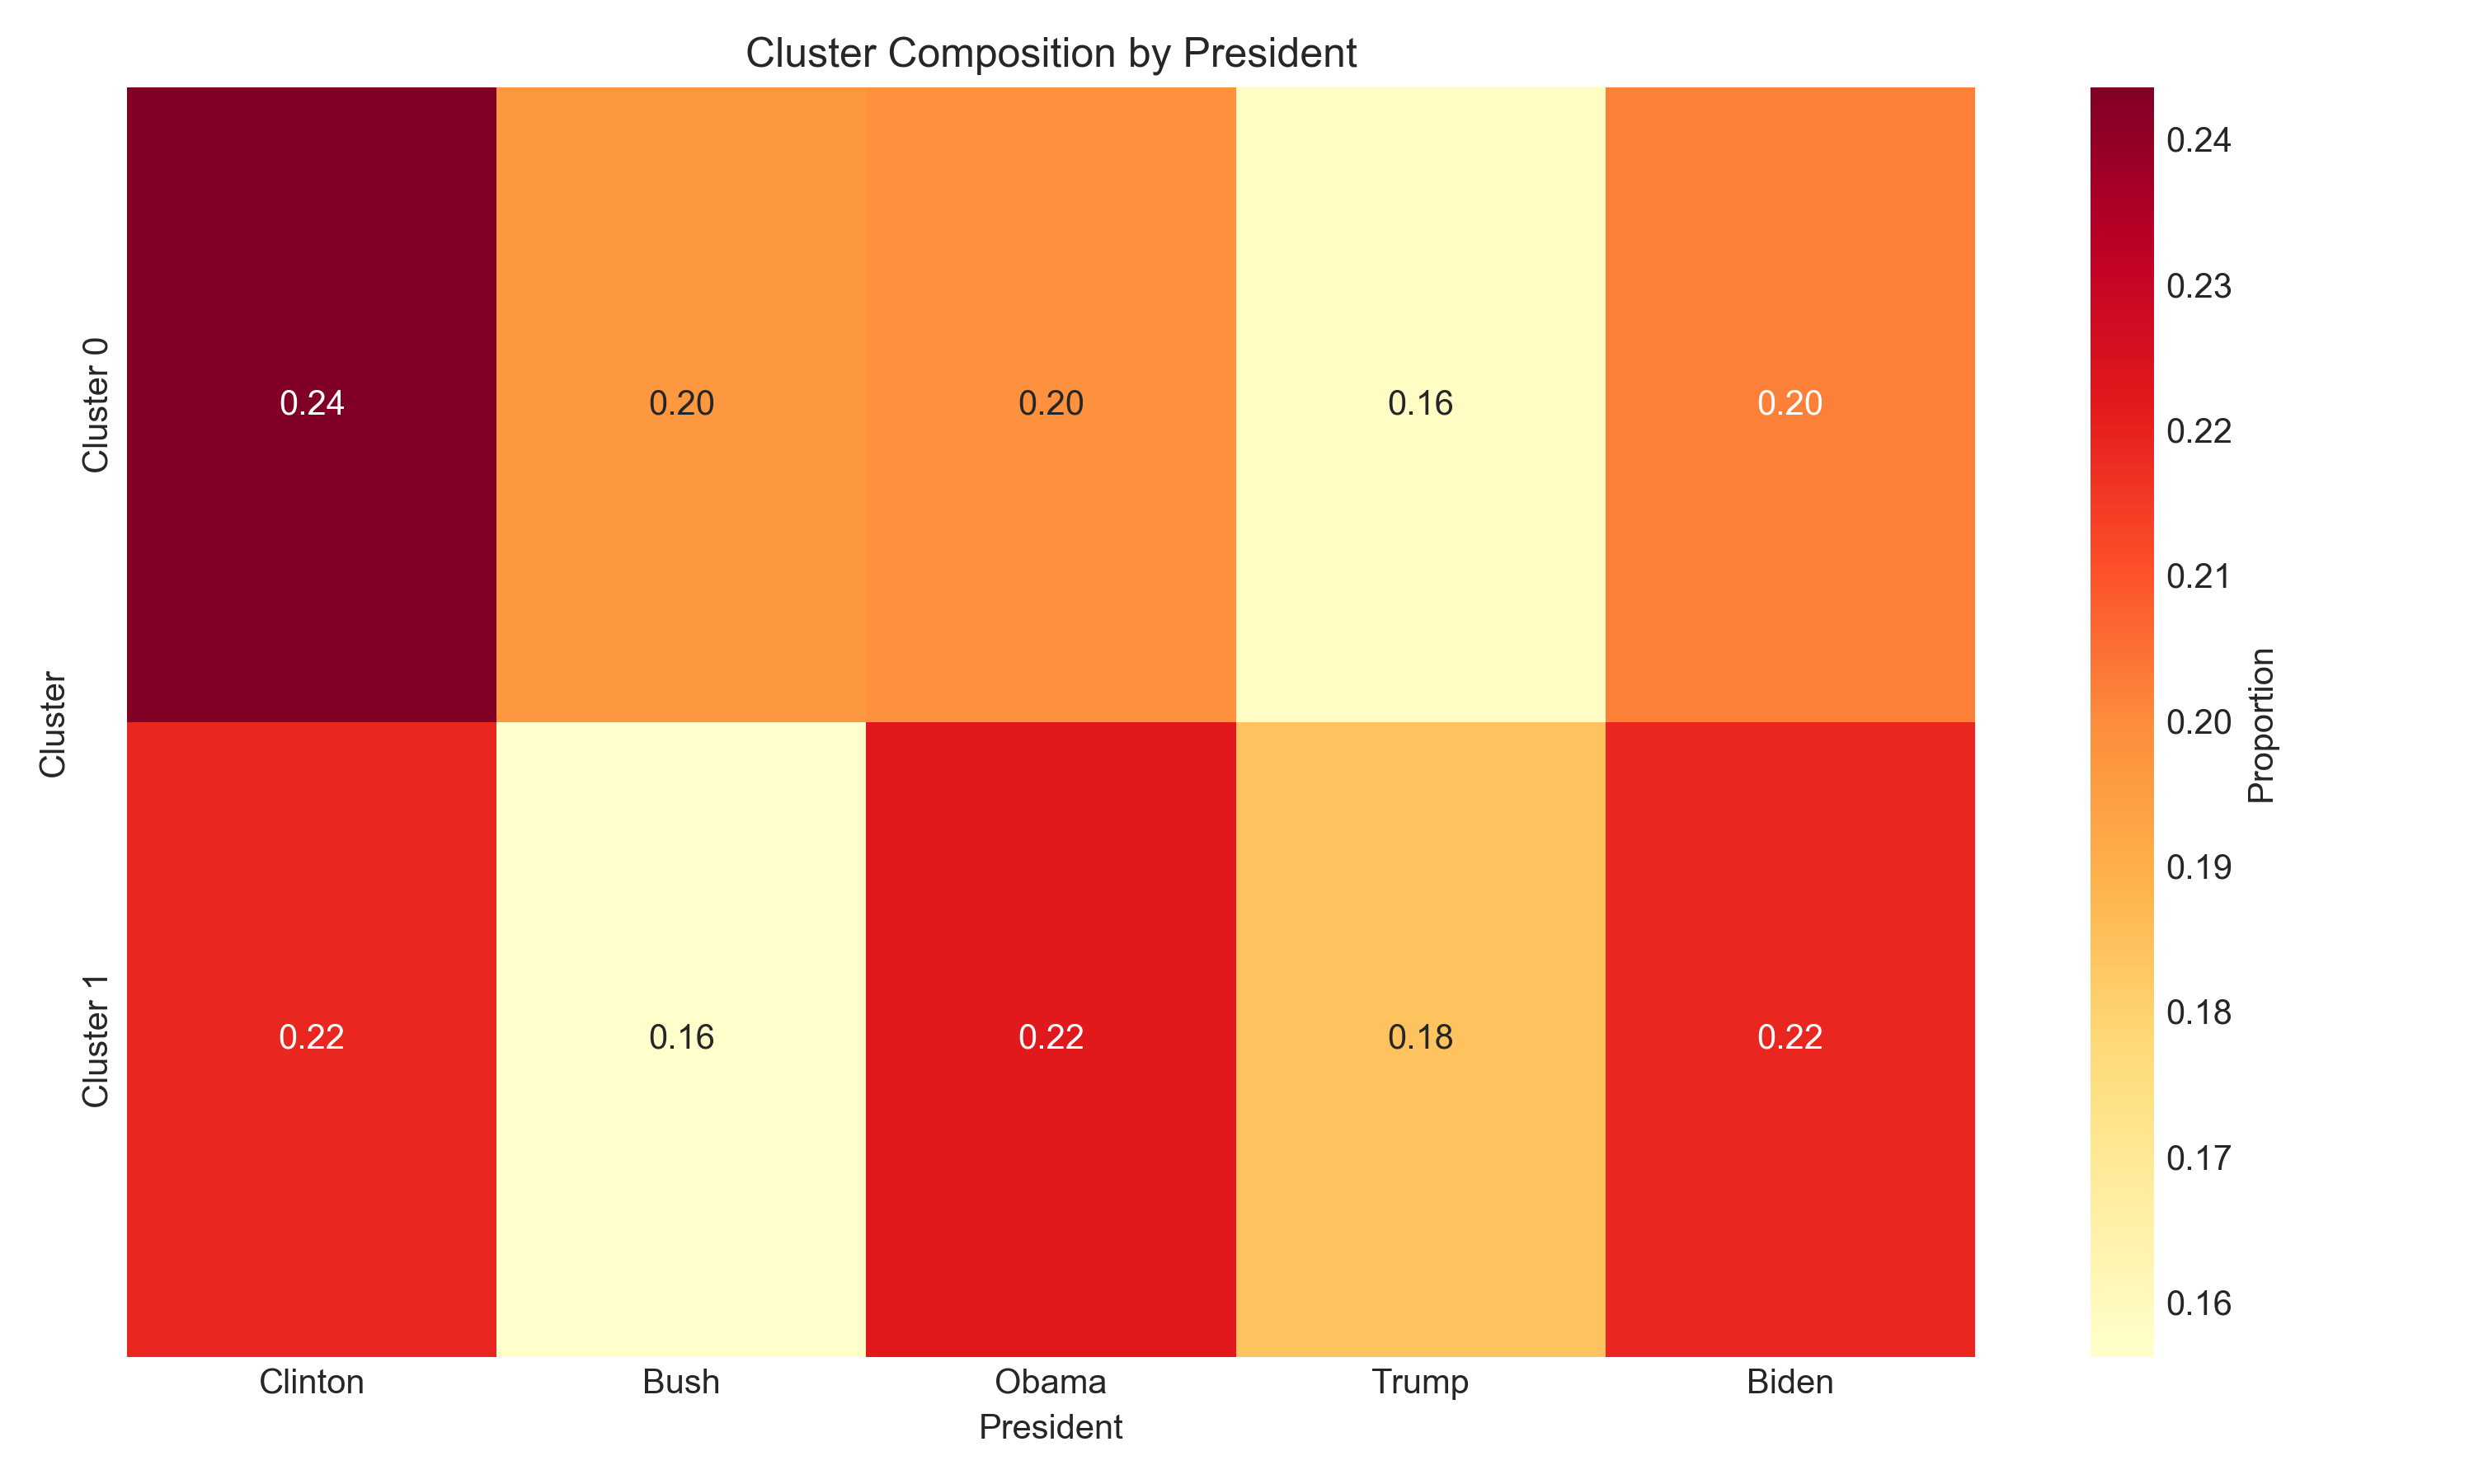
Click image to open full size.
PCA Variance
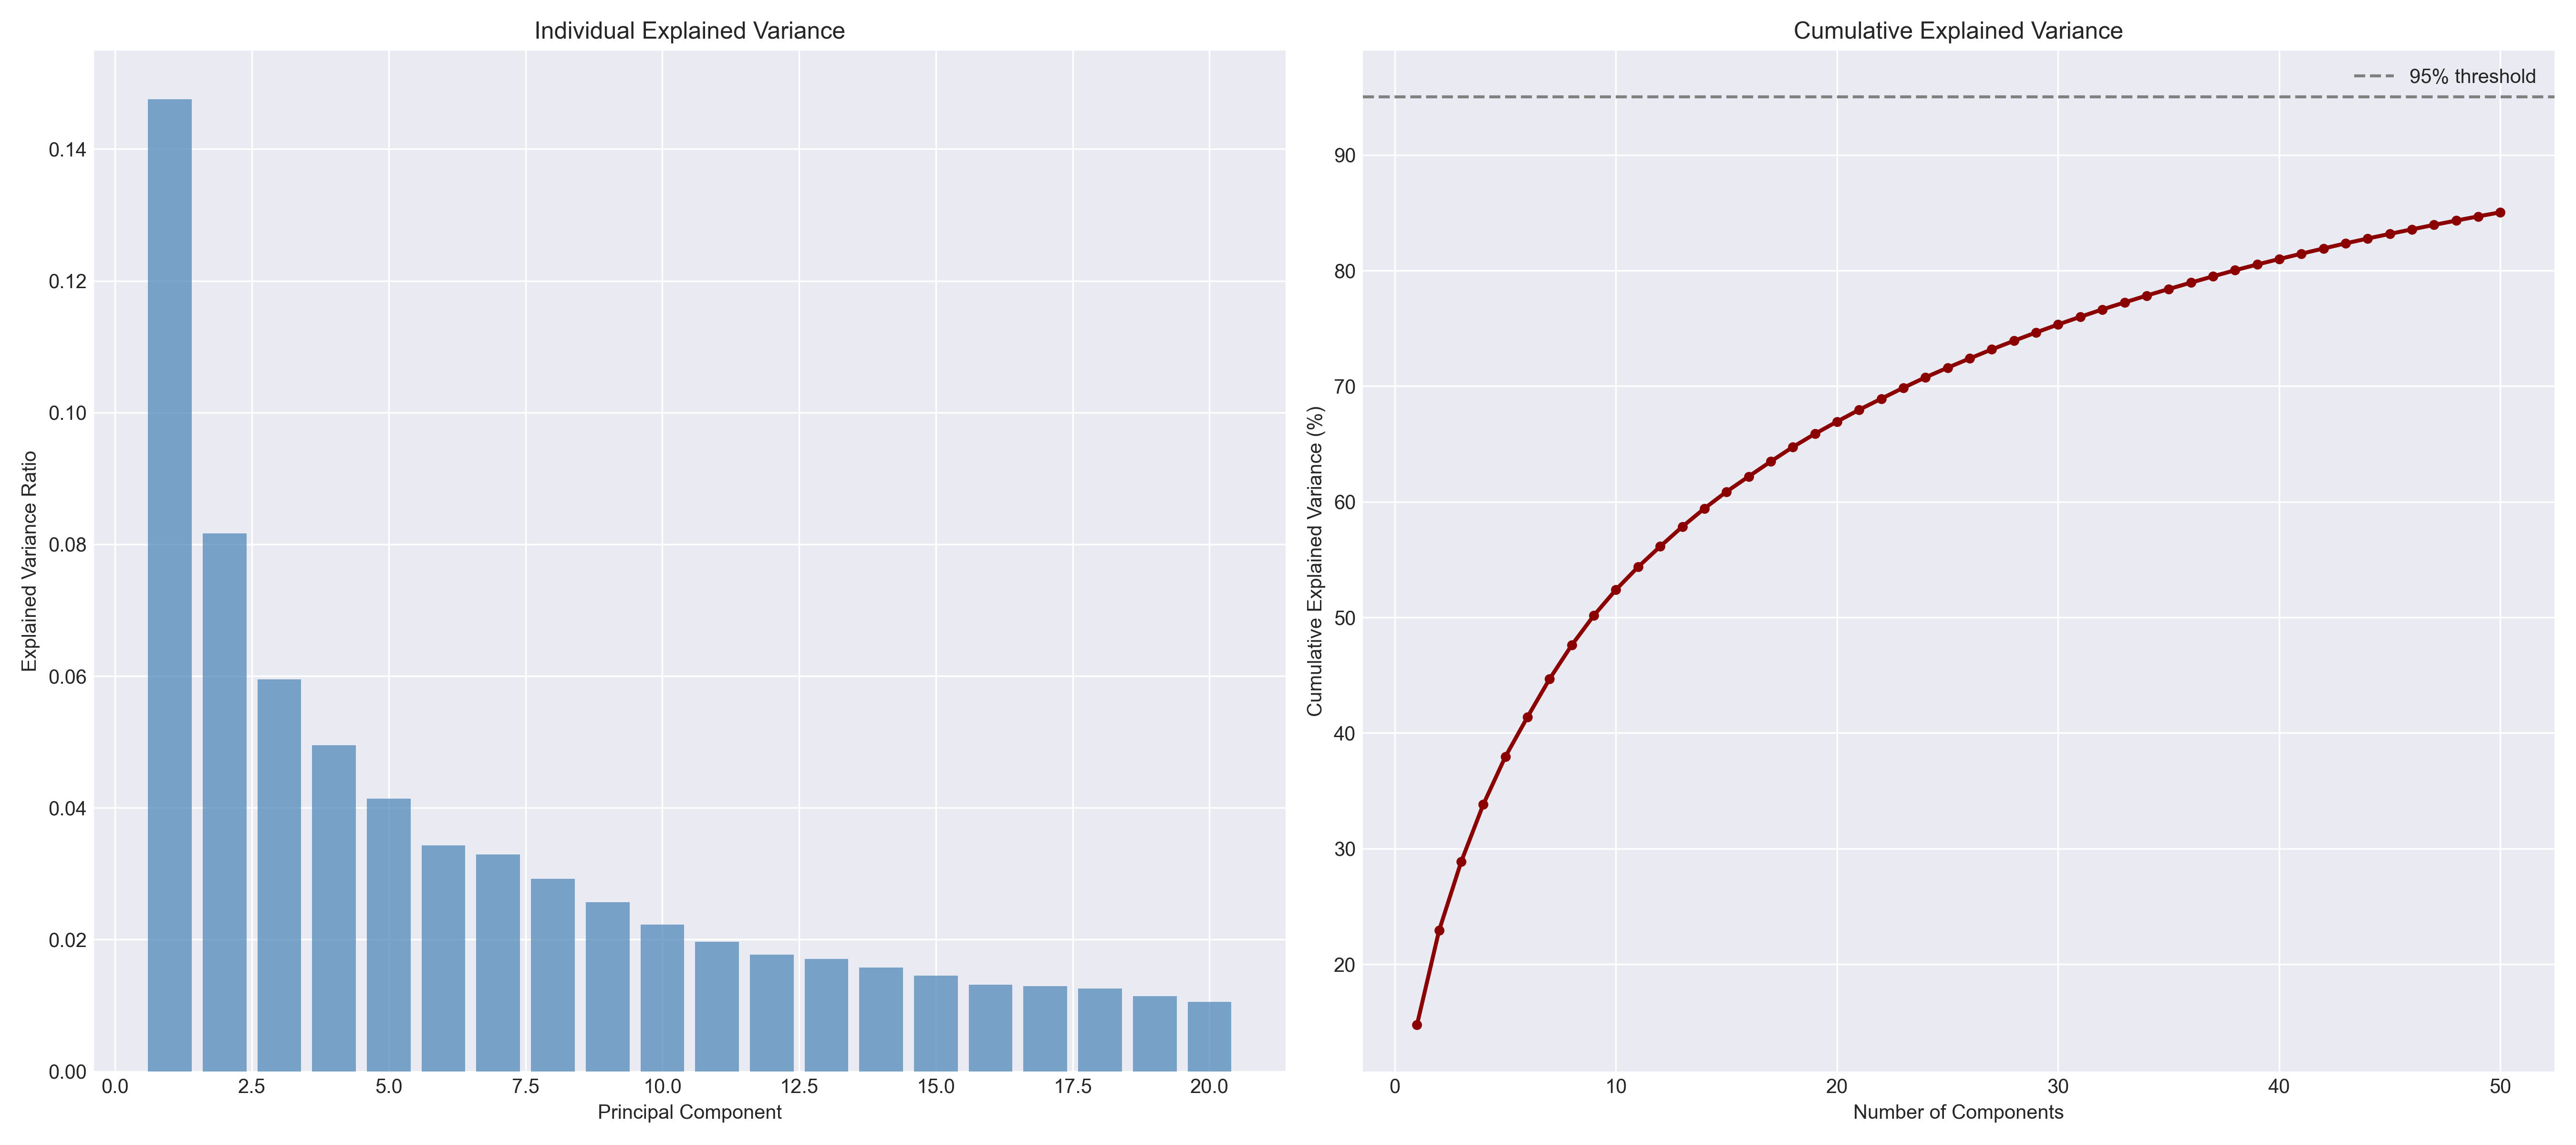
Click image to open full size.
Semantic Trend
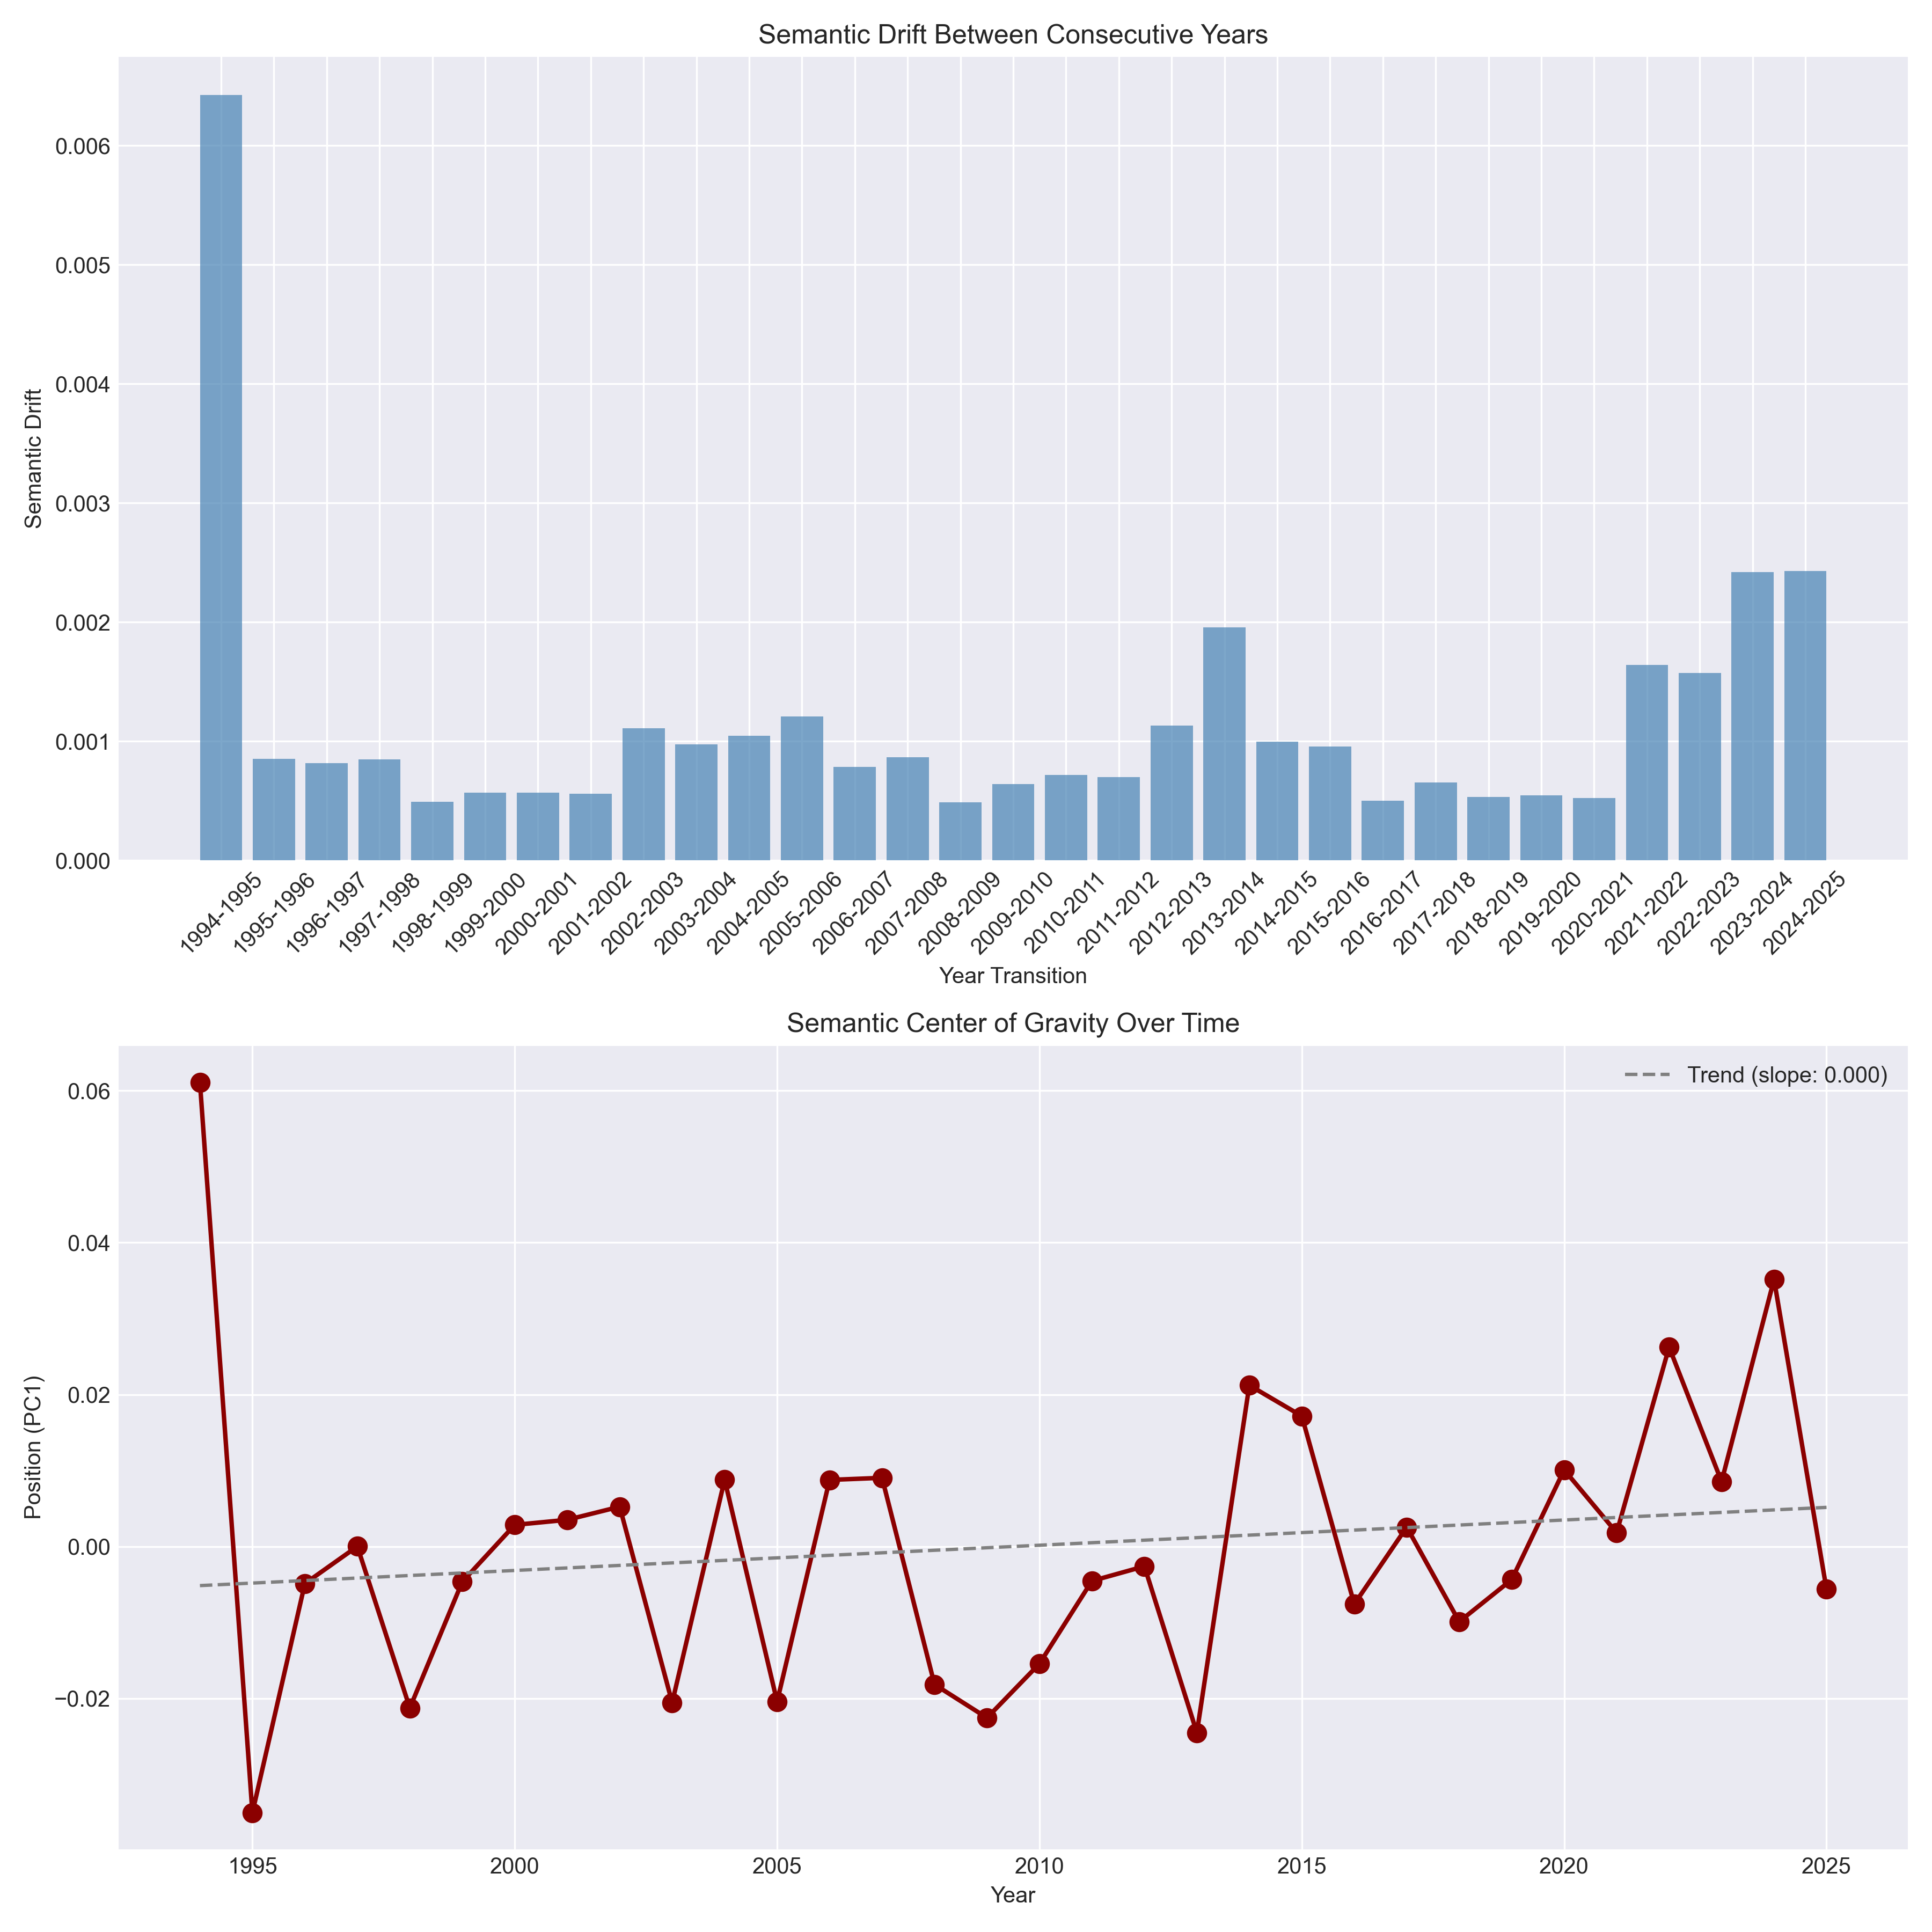
Click image to open full size.
President Panels
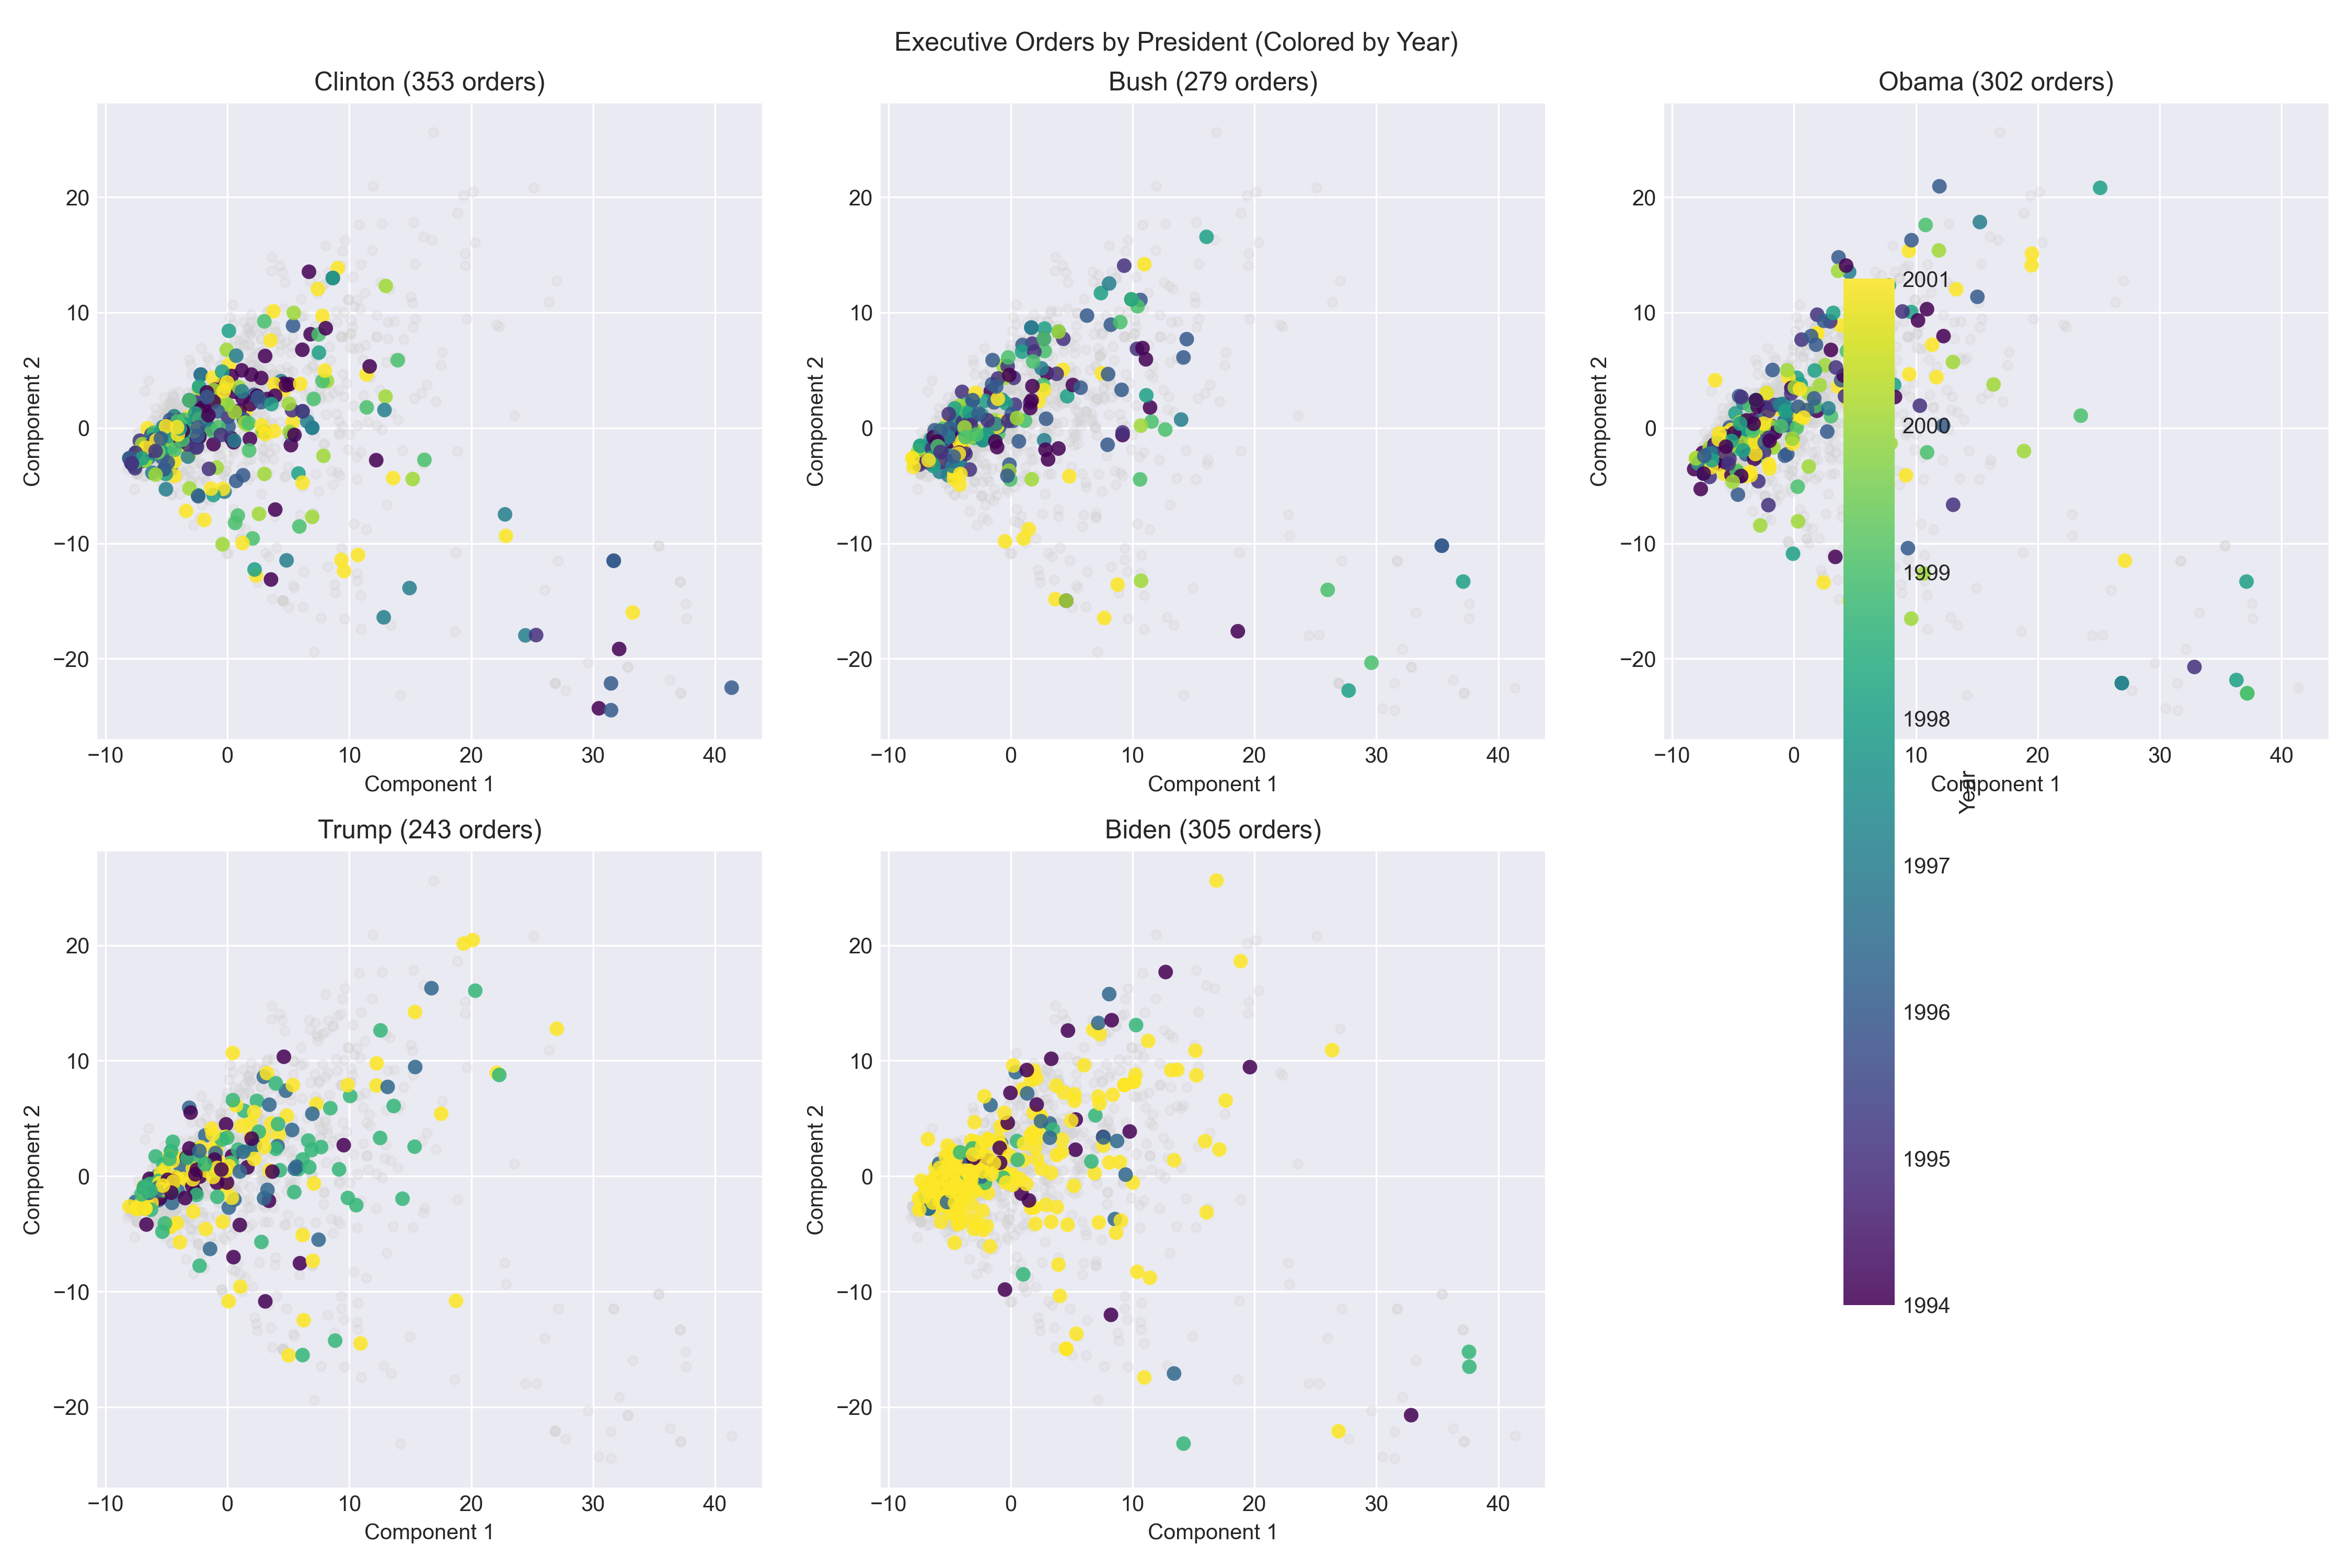
Click image to open full size.
Centroid Trajectory
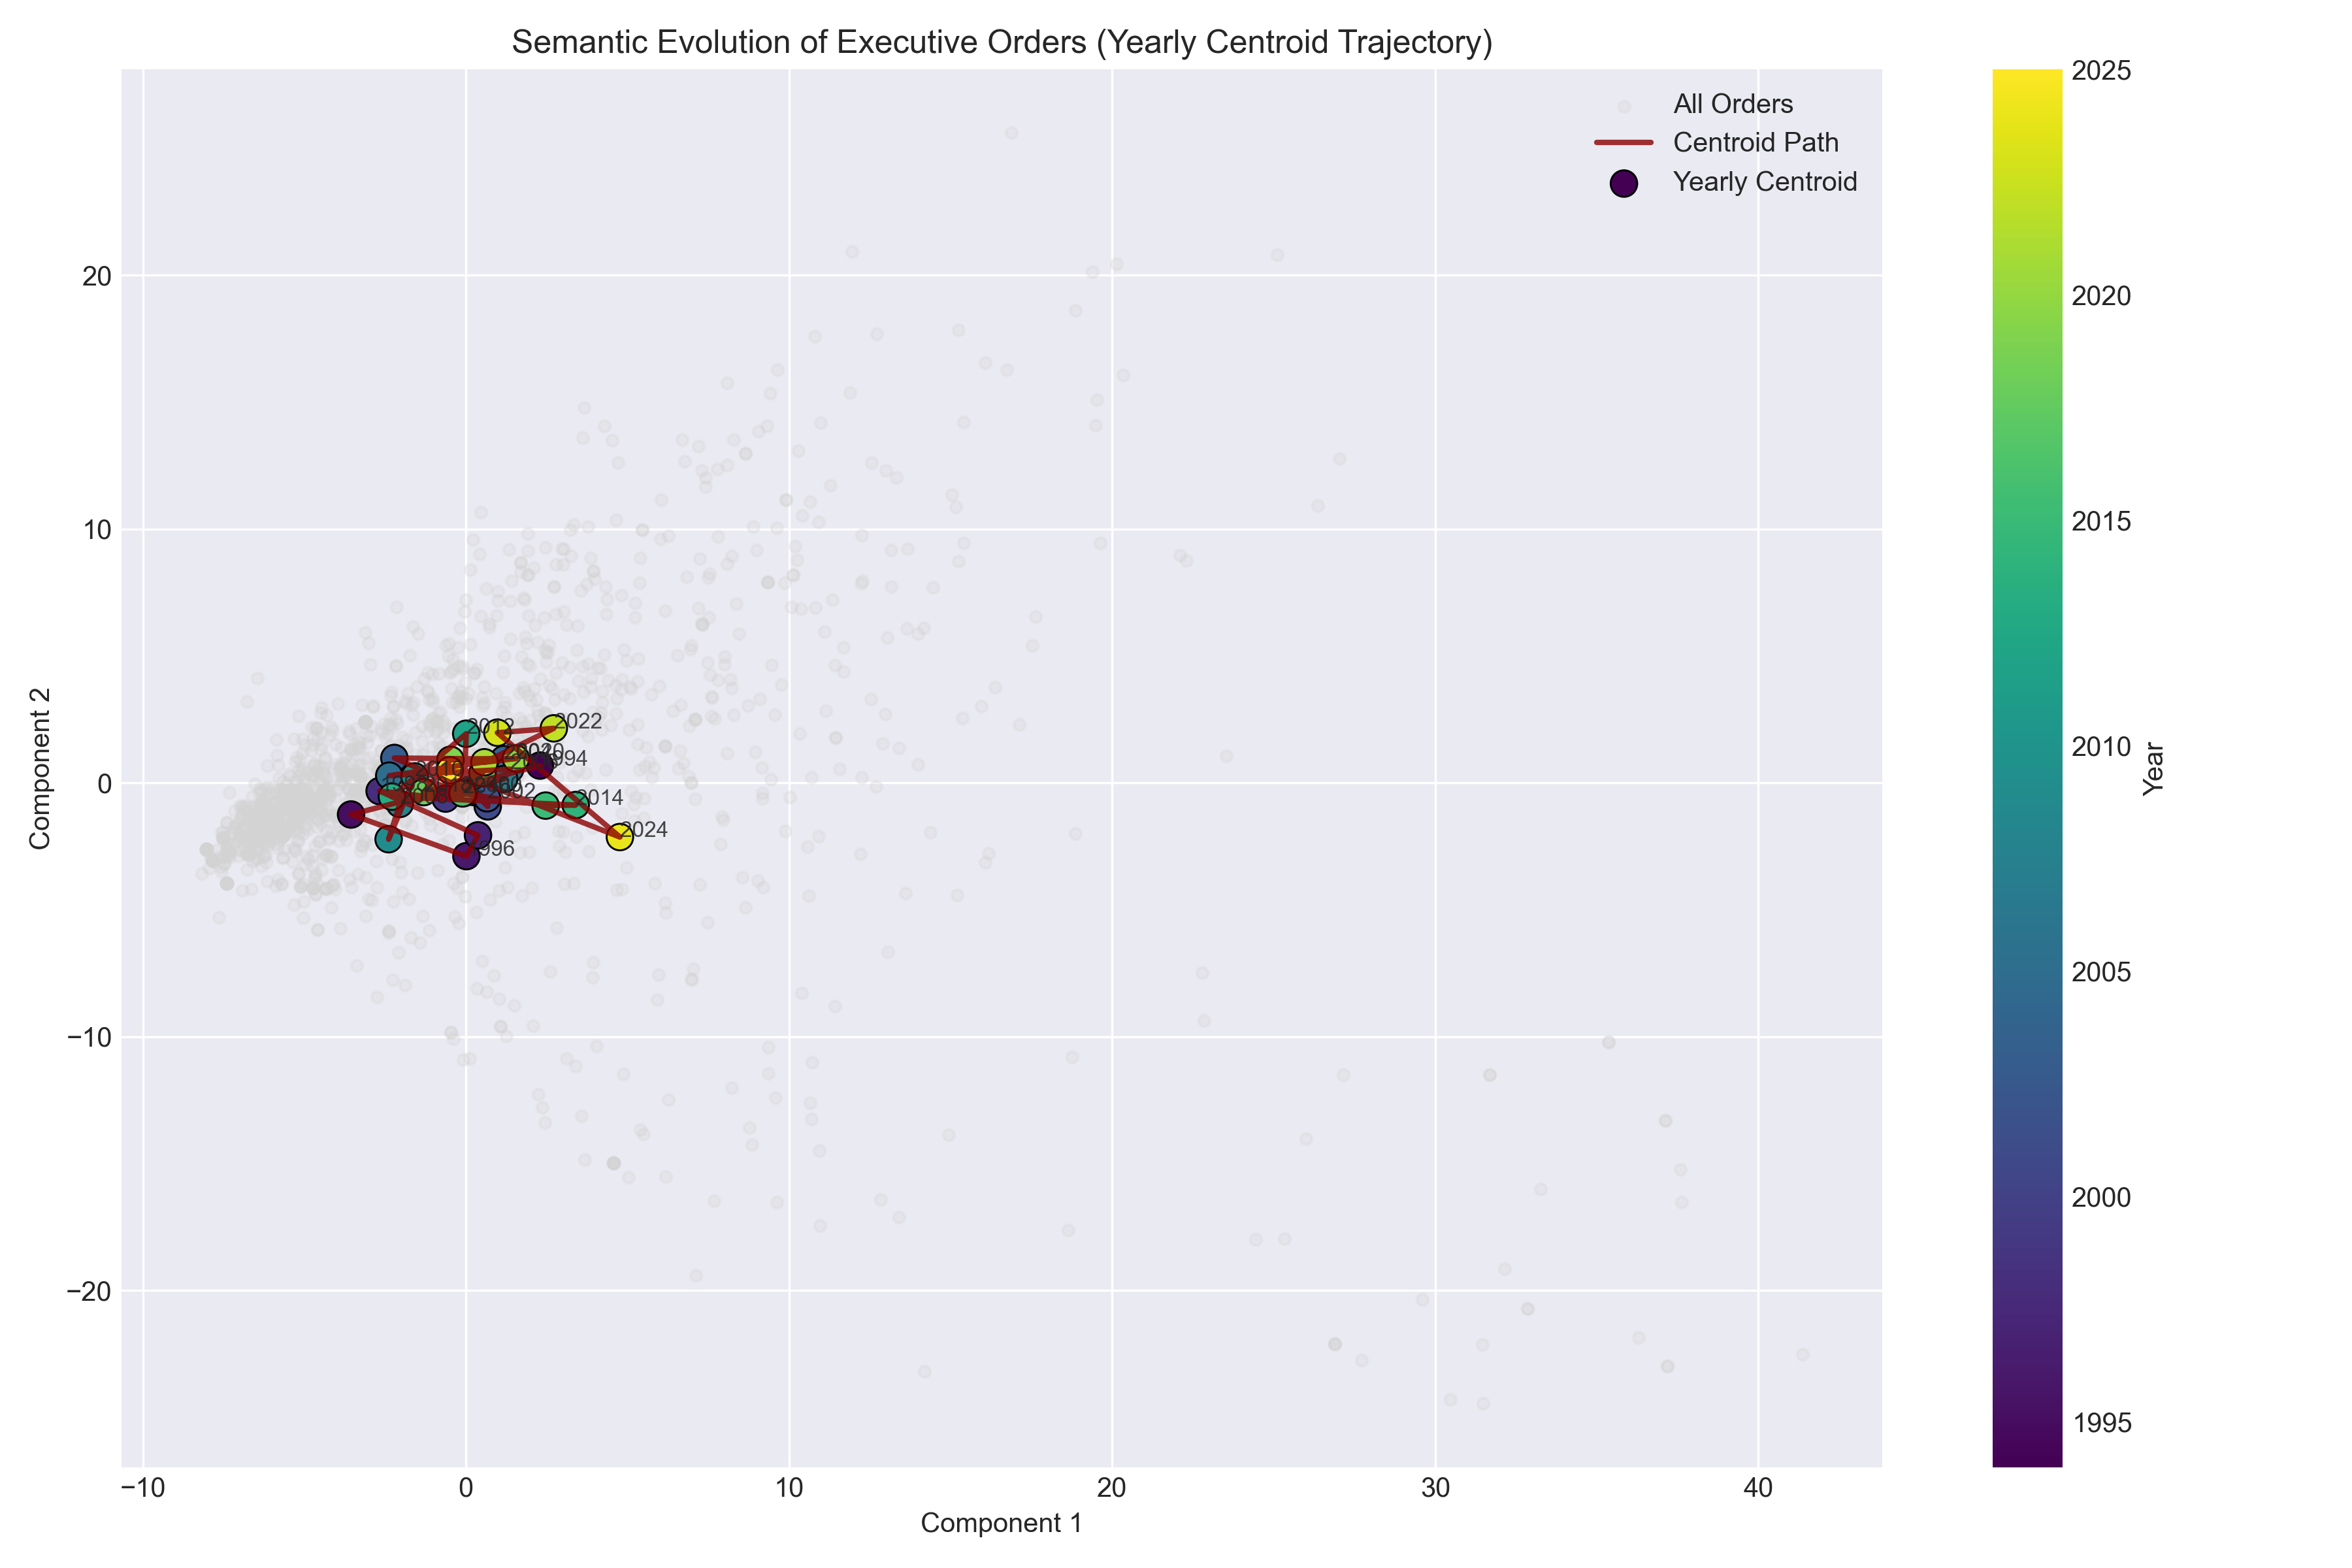
Click image to open full size.